| Hourly Period Analysis |
|
|
|
|
|
|
|
|
| Export
cancelled by user |
|
|
| Hourly
Rolling Period Analysis |
|
|
| Export
cancelled by user |
|
|
| Daily
Period Analysis |
|
|
| Export
cancelled by user |
|
|
| Daily
Rolling Period Analysis |
|
|
| Export
cancelled by user |
|
|
| Weekly
Rolling Period Analysis |
|
|
| Export
cancelled by user |
|
|
| Weekly
Period Analysis |
|
|
| Export
cancelled by user |
|
|
| Monthly
Analysis |
|
|
| Period |
Average Profit |
Gross Profit |
Gross Loss |
Profit Factor |
Average # Trades |
% Profitable |
|
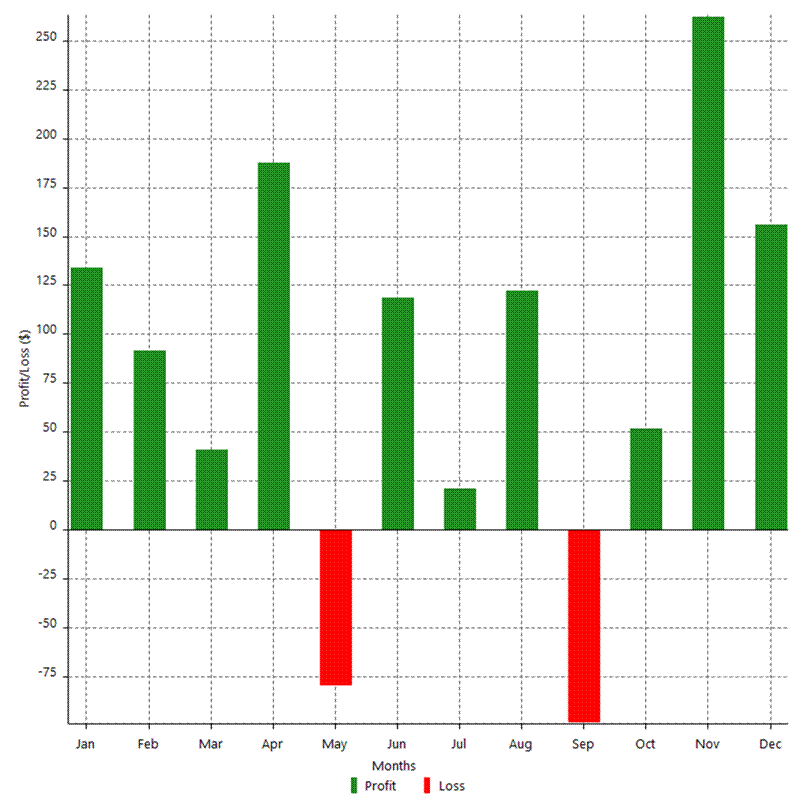
| January |
$ 134.01 |
$6 978.11 |
-$3 091.96 |
2.256856492 |
8.586206897 |
40.16% |
|
| February |
$ 91.48 |
$8 080.51 |
-$5 427.68 |
1.48875947 |
7.862068966 |
39.91% |
|
| March |
$ 41.09 |
$8 420.56 |
-$7 228.93 |
1.164841823 |
8.379310345 |
45.68% |
|
| April |
$ 187.58 |
$7 800.16 |
-$2 360.31 |
3.304718448 |
8.068965517 |
44.02% |
|
| May |
-$ 79.19 |
$4 195.14 |
-$6 491.78 |
-0.646223378 |
8.172413793 |
40.93% |
|
| June |
$ 118.72 |
$6 196.84 |
-$2 753.96 |
2.250156139 |
8.379310345 |
46.91% |
|
| July |
$ 20.72 |
$3 725.06 |
-$3 144.94 |
1.184461389 |
7.642857143 |
38.79% |
|
| August |
$ 122.22 |
$7 299.31 |
-$3 877.04 |
1.882701752 |
8.357142857 |
47.44% |
|
| September |
-$ 98.21 |
$4 534.50 |
-$7 284.28 |
-0.622504901 |
8.714285714 |
38.11% |
|
| October |
$ 51.39 |
$5 830.59 |
-$4 340.25 |
1.343376534 |
8.379310345 |
41.56% |
|
| November |
$ 262.26 |
$10 647.44 |
-$3 041.98 |
3.500167654 |
8.344827586 |
50.00% |
|
| December |
$ 156.15 |
$6 407.26 |
-$1 878.98 |
3.40996711 |
8.206896552 |
49.58% |
|
|
| Monthly
Period Analysis |
|
|
| Export
cancelled by user |
|
|
| Monthly
Rolling Period Analysis |
|
|
| Export
cancelled by user |
|
|
| Annual
Period Analysis |
|
|
| Period |
Profit ($) |
Profit (%) |
Average Profit ($) |
Gross Profit |
Gross Loss |
# Trades |
% Profitable |
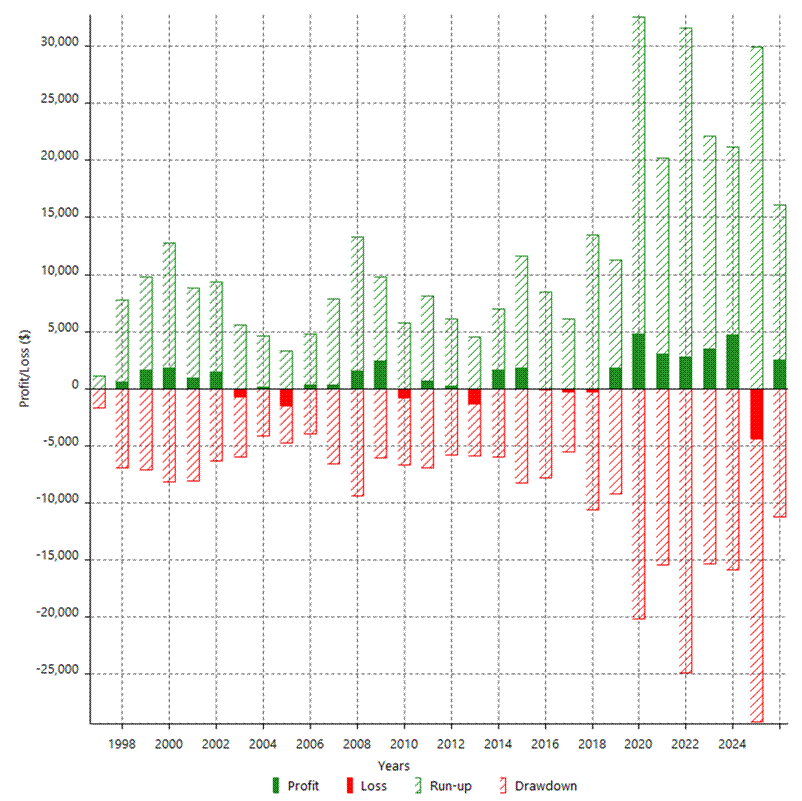
| 2026 |
$2 480.79 |
9.29% |
$ 65.28 |
$8 104.81 |
-$5 624.02 |
38 |
50.00% |
|
| 2025 |
-$4 397.12 |
-14.13% |
-$ 48.86 |
$12 299.66 |
-$16 696.78 |
90 |
40.00% |
|
| 2024 |
$4 722.22 |
17.89% |
$ 70.48 |
$12 264.17 |
-$7 541.95 |
67 |
40.30% |
|
| 2023 |
$3 486.71 |
15.22% |
$ 39.18 |
$10 828.05 |
-$7 341.34 |
89 |
46.07% |
|
| 2022 |
$2 761.10 |
13.71% |
$ 34.09 |
$13 724.62 |
-$10 963.52 |
81 |
44.44% |
|
| 2021 |
$3 051.63 |
17.86% |
$ 33.91 |
$9 721.92 |
-$6 670.29 |
90 |
43.33% |
|
| 2020 |
$4 830.06 |
39.40% |
$ 51.38 |
$15 283.09 |
-$10 453.03 |
94 |
42.55% |
|
| 2019 |
$1 842.35 |
17.69% |
$ 22.75 |
$5 880.51 |
-$4 038.16 |
81 |
50.62% |
|
| 2018 |
-$ 257.33 |
-2.41% |
-$ 3.34 |
$5 966.31 |
-$6 223.64 |
77 |
40.26% |
|
| 2017 |
-$ 302.20 |
-2.75% |
-$ 3.32 |
$2 326.84 |
-$2 629.04 |
91 |
43.96% |
|
| 2016 |
-$ 138.45 |
-1.25% |
-$ 1.52 |
$3 754.62 |
-$3 893.07 |
91 |
40.66% |
|
| 2015 |
$1 782.64 |
19.10% |
$ 19.17 |
$5 671.64 |
-$3 889.00 |
93 |
46.24% |
|
| 2014 |
$1 603.84 |
20.75% |
$ 20.56 |
$4 119.82 |
-$2 515.98 |
78 |
43.59% |
|
| 2013 |
-$1 329.83 |
-14.68% |
-$ 17.27 |
$1 924.33 |
-$3 254.16 |
77 |
32.47% |
|
| 2012 |
$ 268.36 |
3.05% |
$ 3.19 |
$2 893.25 |
-$2 624.89 |
84 |
45.24% |
|
| 2011 |
$ 706.02 |
8.73% |
$ 8.61 |
$3 828.29 |
-$3 122.27 |
82 |
46.34% |
|
| 2010 |
-$ 816.64 |
-9.18% |
-$ 9.72 |
$2 703.65 |
-$3 520.29 |
84 |
39.29% |
|
| 2009 |
$2 400.83 |
36.94% |
$ 24.01 |
$5 169.91 |
-$2 769.08 |
100 |
49.00% |
|
| 2008 |
$1 576.63 |
32.03% |
$ 17.52 |
$5 598.98 |
-$4 022.35 |
90 |
50.00% |
|
| 2007 |
$ 322.16 |
7.00% |
$ 3.25 |
$3 277.45 |
-$2 955.29 |
99 |
48.48% |
|
| 2006 |
$ 308.49 |
7.19% |
$ 3.15 |
$2 065.79 |
-$1 757.30 |
98 |
38.78% |
|
| 2005 |
-$1 530.87 |
-26.29% |
-$ 17.01 |
$1 146.23 |
-$2 677.10 |
90 |
35.56% |
|
| 2004 |
$ 160.99 |
2.84% |
$ 1.64 |
$2 097.36 |
-$1 936.37 |
98 |
33.67% |
|
| 2003 |
-$ 695.66 |
-10.94% |
-$ 6.75 |
$2 283.21 |
-$2 978.87 |
103 |
37.86% |
|
| 2002 |
$1 439.13 |
29.26% |
$ 15.99 |
$4 555.59 |
-$3 116.46 |
90 |
44.44% |
|
| 2001 |
$ 955.46 |
24.11% |
$ 10.74 |
$4 133.13 |
-$3 177.67 |
89 |
44.94% |
|
| 2000 |
$1 769.37 |
80.66% |
$ 20.34 |
$6 031.96 |
-$4 262.59 |
87 |
44.83% |
|
| 1999 |
$1 640.22 |
296.34% |
$ 17.83 |
$4 503.54 |
-$2 863.32 |
92 |
54.35% |
|
| 1998 |
$ 563.89 |
5422.02% |
$ 6.06 |
$3 728.25 |
-$3 164.36 |
93 |
40.86% |
|
| 1997 |
-$ 11.40 |
-1140.00% |
-$ 0.63 |
$ 456.74 |
-$ 468.14 |
18 |
55.56% |
|
|
| Annual
Rolling Period Analysis |
|
|
| Period |
Profit ($) |
Profit (%) |
Average Profit ($) |
Gross Profit |
Gross Loss |
# Trades |
% Profitable |
| Today - 2026 |
$2 480.79 |
9.29% |
$ 65.28 |
$8 104.81 |
-$5 624.02 |
38 |
50.00% |
|
| 2025 - 2026 |
-$1 916.33 |
-6.16% |
-$ 15.09 |
$20 404.47 |
-$22 320.80 |
127 |
42.52% |
|
| 2024 - 2026 |
$2 805.89 |
10.63% |
$ 14.54 |
$32 546.10 |
-$29 740.21 |
193 |
41.97% |
|
| 2023 - 2026 |
$6 292.60 |
27.48% |
$ 22.39 |
$43 374.15 |
-$37 081.55 |
281 |
43.06% |
|
| 2022 - 2026 |
$9 053.70 |
44.95% |
$ 25.08 |
$56 970.06 |
-$47 916.36 |
361 |
43.21% |
|
| 2021 - 2026 |
$12 105.33 |
70.84% |
$ 26.90 |
$66 691.98 |
-$54 586.65 |
450 |
43.33% |
|
| 2020 - 2026 |
$16 935.39 |
138.15% |
$ 31.19 |
$81 975.07 |
-$65 039.68 |
543 |
43.09% |
|
| 2019 - 2026 |
$18 777.74 |
180.27% |
$ 30.14 |
$87 855.58 |
-$69 077.84 |
623 |
44.14% |
|
| 2018 - 2026 |
$18 520.41 |
173.51% |
$ 26.50 |
$93 821.89 |
-$75 301.48 |
699 |
43.63% |
|
| 2017 - 2026 |
$18 218.21 |
165.98% |
$ 23.09 |
$96 091.27 |
-$77 873.06 |
789 |
43.60% |
|
| 2016 - 2026 |
$18 079.76 |
162.67% |
$ 20.57 |
$99 755.85 |
-$81 676.09 |
879 |
43.34% |
|
| 2015 - 2026 |
$19 862.40 |
212.84% |
$ 20.46 |
$105 427.49 |
-$85 565.09 |
971 |
43.56% |
|
| 2014 - 2026 |
$21 466.24 |
277.77% |
$ 20.48 |
$109 547.31 |
-$88 081.07 |
1048 |
43.51% |
|
| 2013 - 2026 |
$20 136.41 |
222.31% |
$ 17.91 |
$111 424.18 |
-$91 287.77 |
1124 |
42.70% |
|
| 2012 - 2026 |
$20 404.77 |
232.15% |
$ 16.91 |
$114 317.43 |
-$93 912.66 |
1207 |
42.83% |
|
| 2011 - 2026 |
$21 110.79 |
261.16% |
$ 16.39 |
$118 144.51 |
-$97 033.72 |
1288 |
43.01% |
|
| 2010 - 2026 |
$20 294.15 |
228.02% |
$ 14.80 |
$120 848.16 |
-$100 554.01 |
1371 |
42.74% |
|
| 2009 - 2026 |
$22 694.98 |
349.19% |
$ 15.44 |
$125 985.61 |
-$103 290.63 |
1470 |
43.13% |
|
| 2008 - 2026 |
$24 271.61 |
493.05% |
$ 15.57 |
$131 584.59 |
-$107 312.98 |
1559 |
43.49% |
|
| 2007 - 2026 |
$24 593.77 |
534.58% |
$ 14.84 |
$134 862.04 |
-$110 268.27 |
1657 |
43.75% |
|
| 2006 - 2026 |
$24 902.26 |
580.18% |
$ 14.20 |
$136 911.62 |
-$112 009.36 |
1754 |
43.44% |
|
| 2005 - 2026 |
$23 371.39 |
401.36% |
$ 12.68 |
$138 037.81 |
-$114 666.42 |
1843 |
43.08% |
|
| 2004 - 2026 |
$23 532.38 |
415.62% |
$ 12.13 |
$140 132.63 |
-$116 600.25 |
1940 |
42.63% |
|
| 2003 - 2026 |
$22 836.72 |
359.20% |
$ 11.18 |
$142 400.80 |
-$119 564.08 |
2042 |
42.41% |
|
| 2002 - 2026 |
$24 275.85 |
493.56% |
$ 11.39 |
$146 956.39 |
-$122 680.54 |
2131 |
42.47% |
|
| 2001 - 2026 |
$25 231.31 |
636.66% |
$ 11.37 |
$151 065.73 |
-$125 834.42 |
2219 |
42.59% |
|
| 2000 - 2026 |
$27 000.68 |
1230.82% |
$ 11.71 |
$157 097.69 |
-$130 097.01 |
2305 |
42.65% |
|
| 1999 - 2026 |
$28 640.90 |
5174.60% |
$ 11.95 |
$161 536.19 |
-$132 895.29 |
2396 |
43.11% |
|
| 1998 - 2026 |
$29 204.79 |
280815.29% |
$ 11.74 |
$165 264.44 |
-$136 059.65 |
2488 |
43.01% |
|
| 1997 - 2026 |
$29 193.39 |
2919339.00% |
$ 11.65 |
$165 709.89 |
-$136 516.50 |
2505 |
43.11% |
|
|
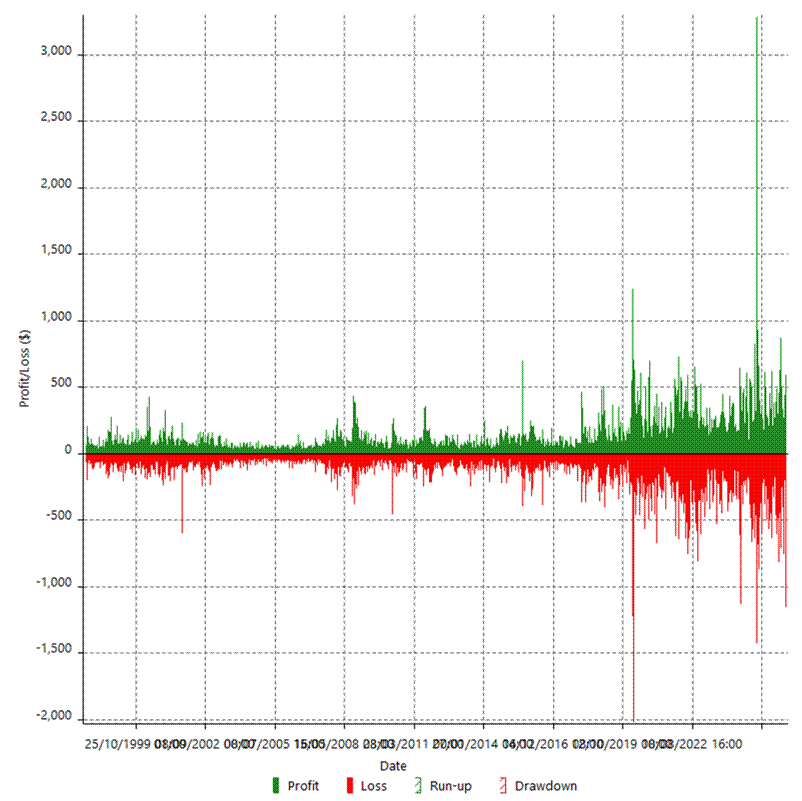
| Hourly
Returns & Drawdowns |
|
|
|
|
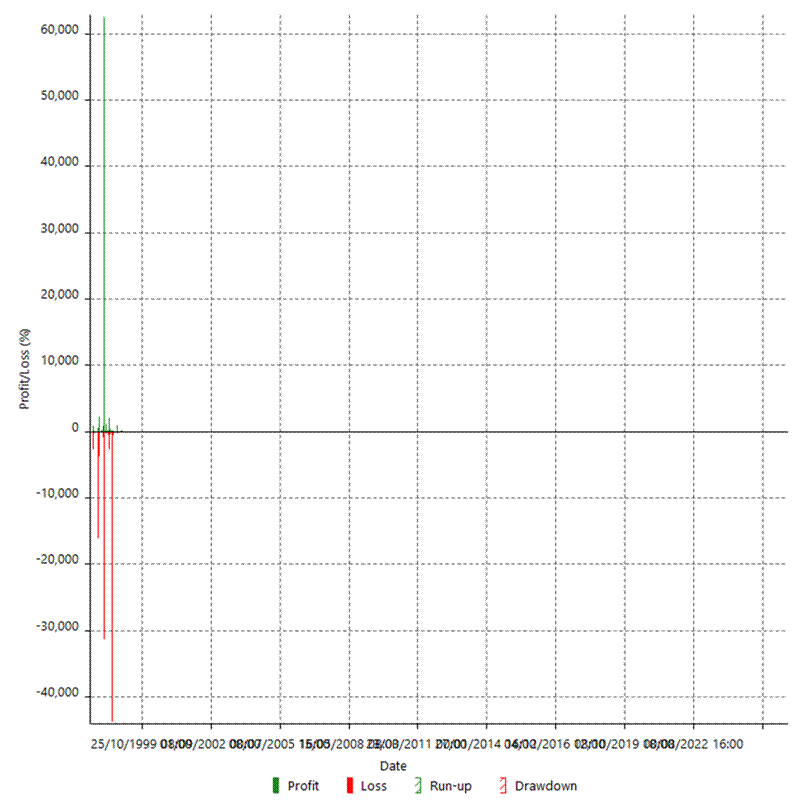
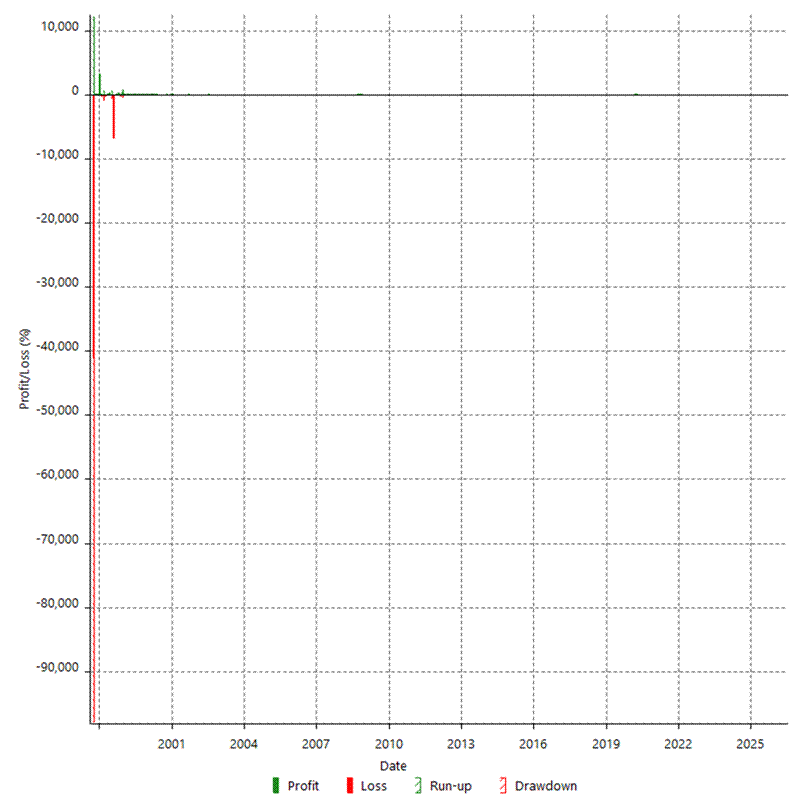
| Hourly
Returns & Drawdowns (%) |
|
|
|
|
|
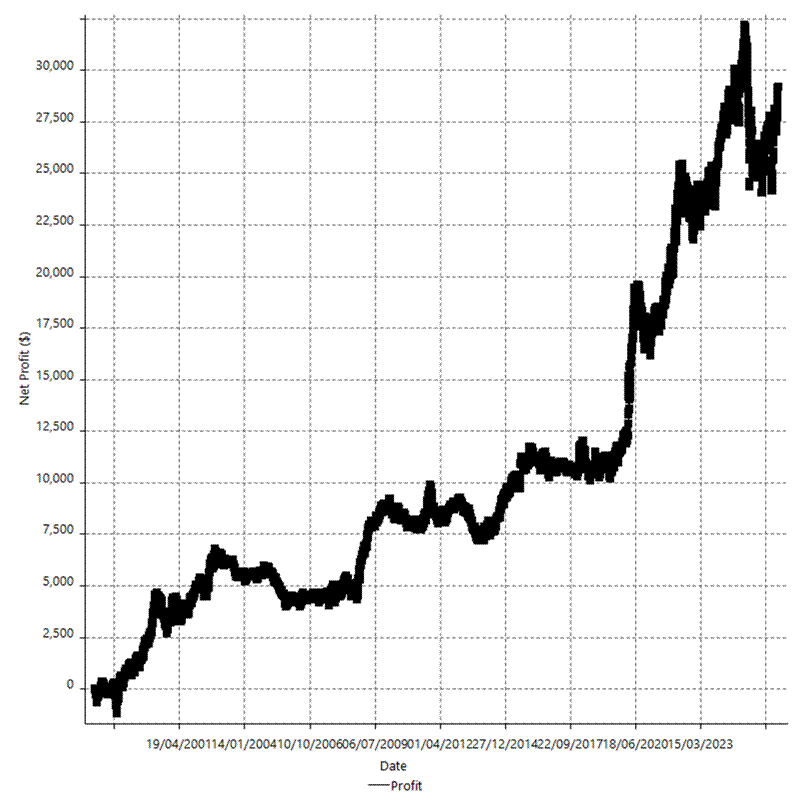
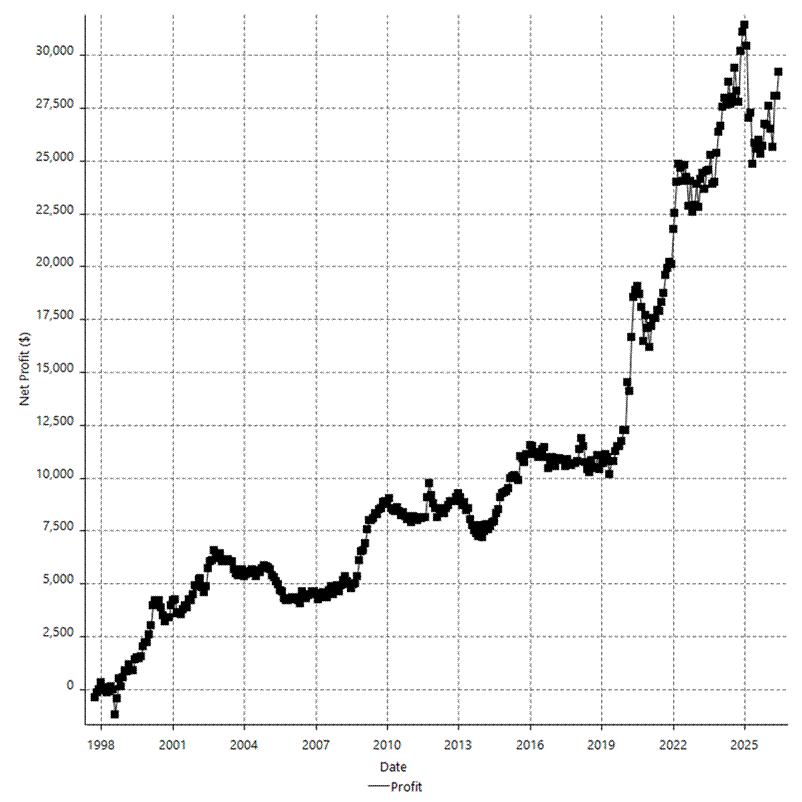
| Hourly
Accumulative Net Profit |
|
|

|
|
|
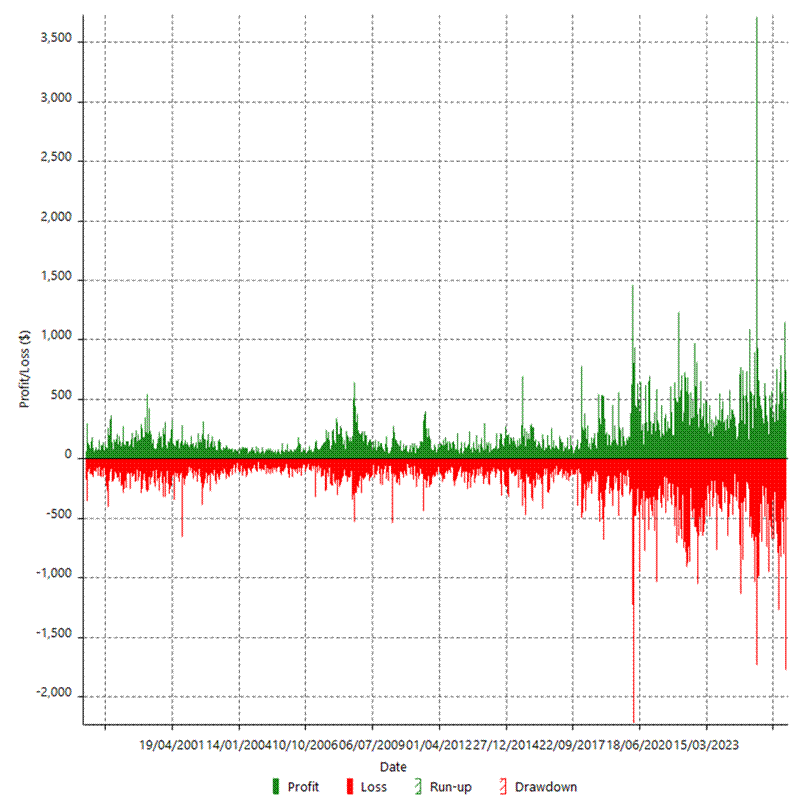
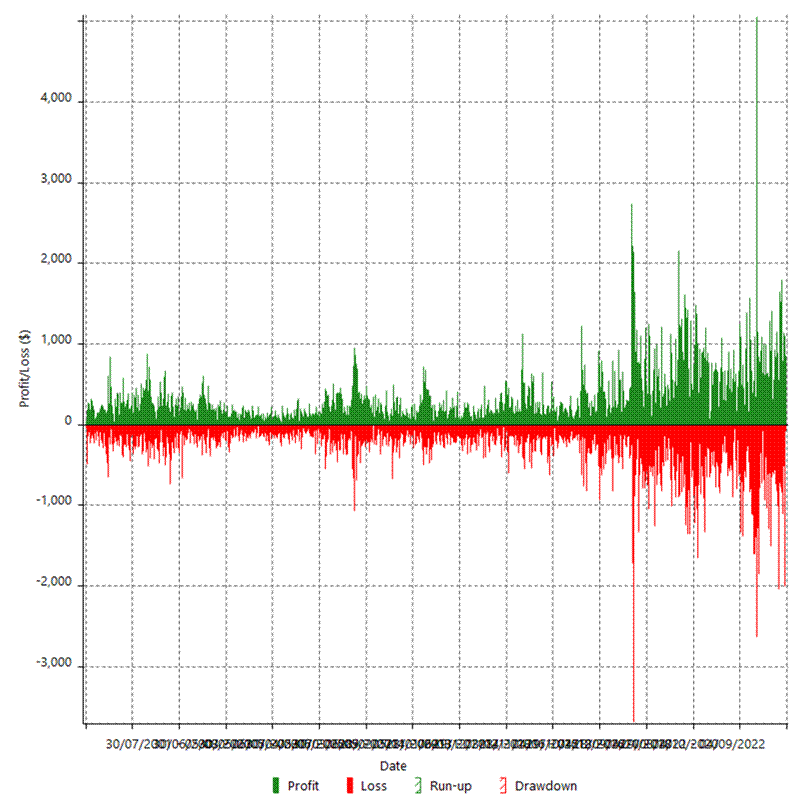
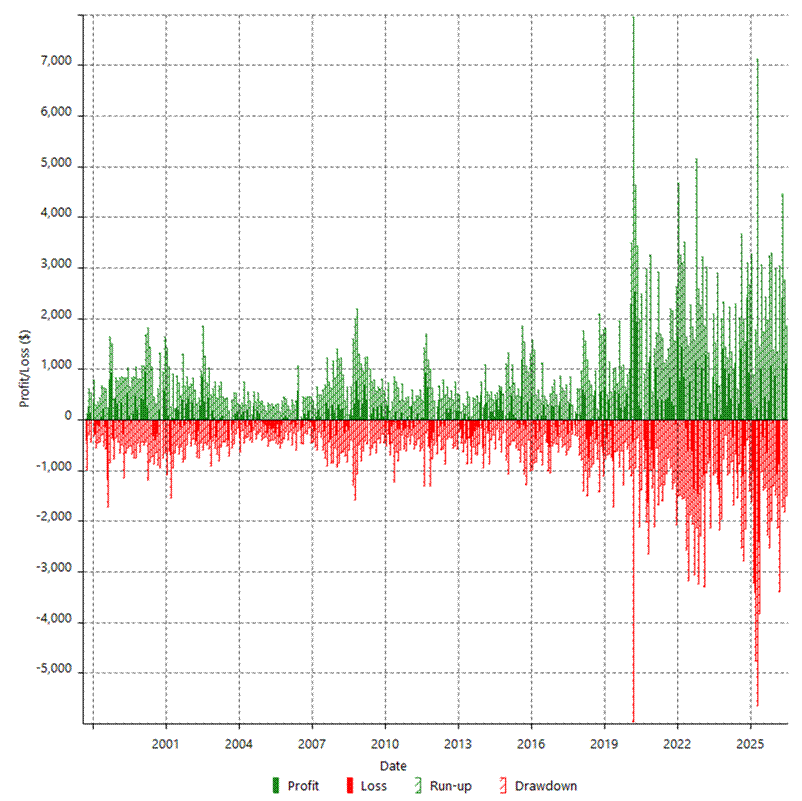
| Daily
Returns & Drawdowns |
|
|
|
|
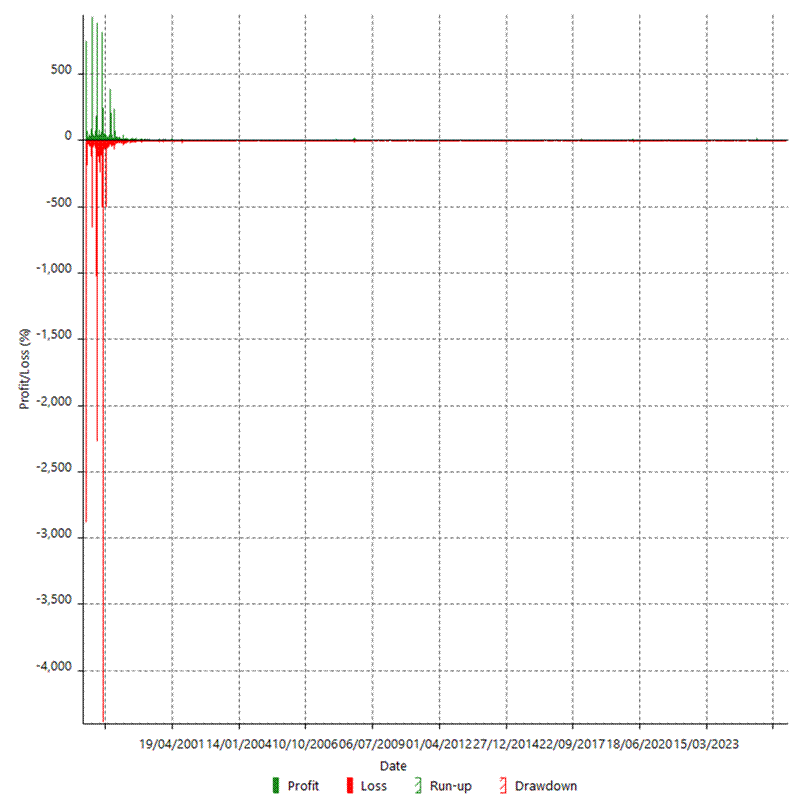
| Daily
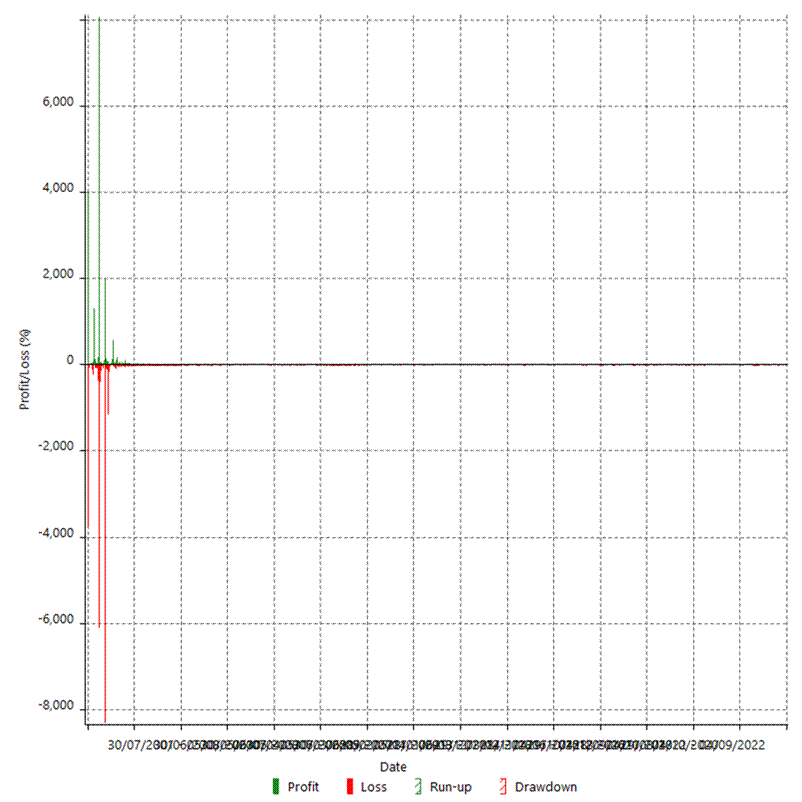
Returns & Drawdowns (%) |
|
|
|
|
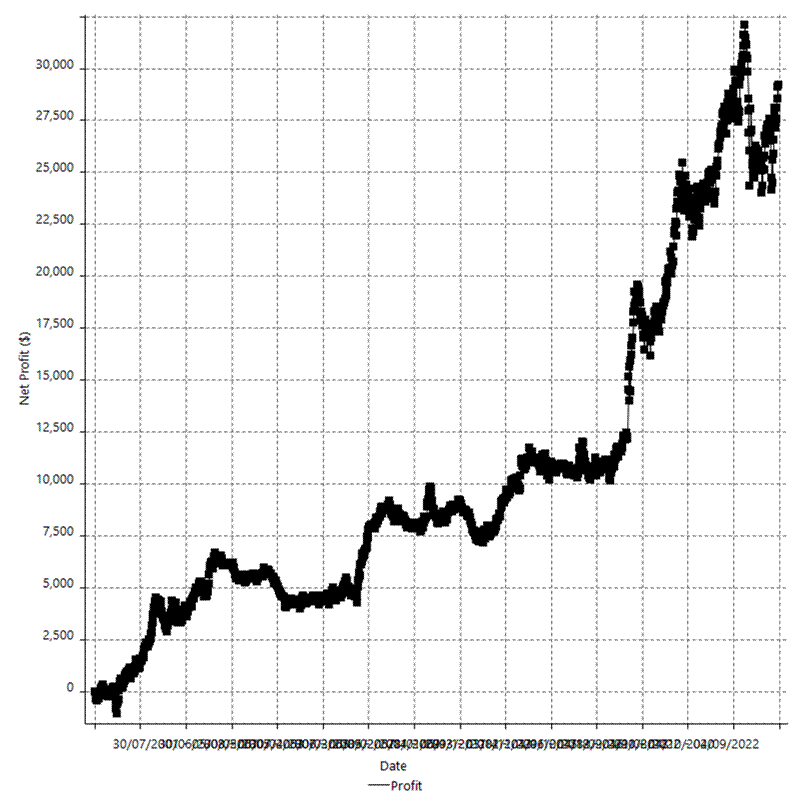
| Daily
Accumulative Net Profit |
|
|
|
|
|
| Weekly
Returns & Drawdowns |
|
|
|
|
|
| Weekly
Returns & Drawdowns (%) |
|
|
|
|
| Weekly
Accumulative Net Profit |
|
|
|
|
| Monthly
Returns & Drawdowns |
|
|
|
|
|
| Monthly
Returns & Drawdowns (%) |
|
|
|
|
|
| Monthly
Accumulative Net Profit |
|
|
|
|
| Average
Profit By Month |
|
|
|
|
| Annual
Returns & Drawdowns |
|
|
|
|
|
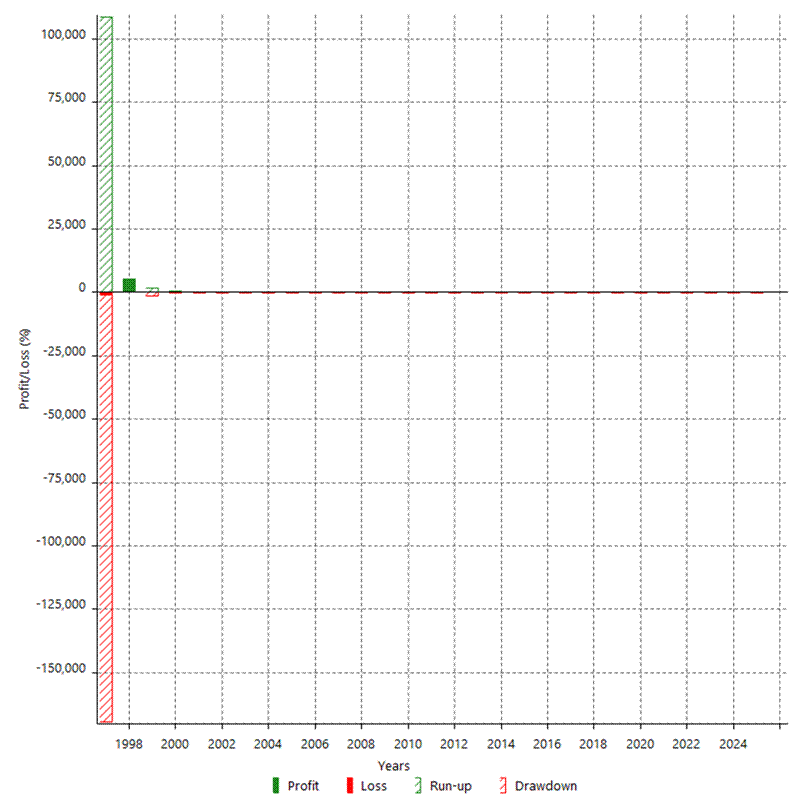
| Annual
Returns & Drawdowns (%) |
|
|
|
|
|
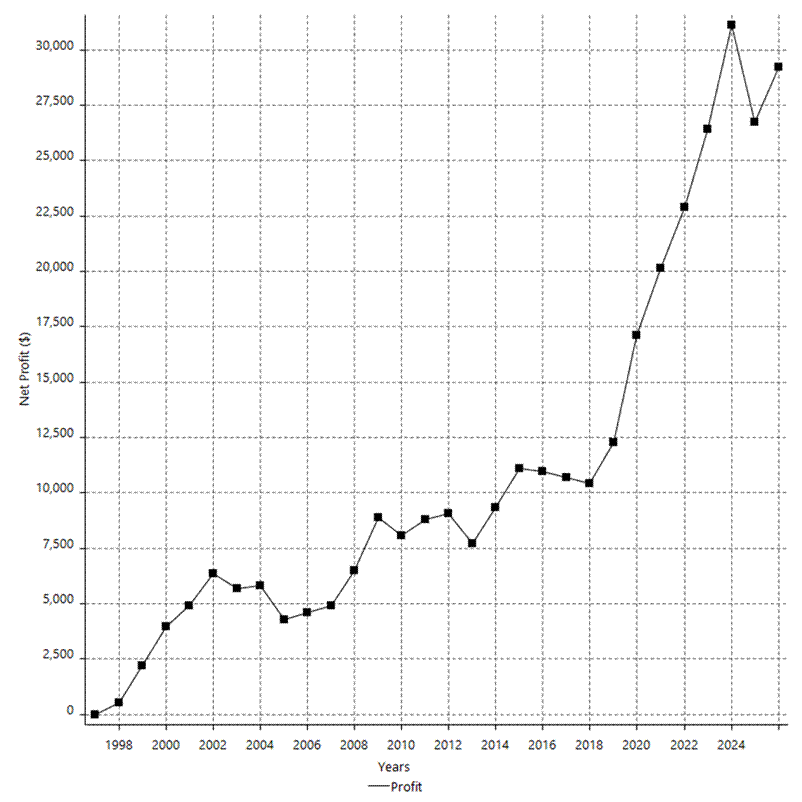
| Annual
Accumulative Net Profit |
|
|
|
|
|
|
|
|
|
|
|
|
|