| Strategy
Performance Summary |
|
|
|
|
|
|
|
All Trades |
Long Trades |
Short Trades |
|
| Net Profit |
$28 300.64 |
$28 240.32 |
$ 60.32 |
|
| Gross Profit |
$169 979.82 |
$88 843.62 |
$81 136.20 |
|
| Gross Loss |
-$141 679.18 |
-$60 603.30 |
-$81 075.88 |
|
| Adjusted Net Profit |
$19 482.33 |
$22 281.94 |
-$6 439.66 |
|
| Adjusted Gross Profit |
$165 346.69 |
$85 568.80 |
$77 851.09 |
|
| Adjusted Gross Loss |
-$145 864.36 |
-$63 286.86 |
-$84 290.75 |
|
| Select Net Profit |
$26 125.50 |
$26 478.64 |
-$ 353.14 |
|
| Select Gross Profit |
$105 184.10 |
$58 572.17 |
$46 611.93 |
|
| Select Gross Loss |
-$79 058.60 |
-$32 093.53 |
-$46 965.07 |
|
| Account Size Required |
$4 459.77 |
$3 217.85 |
$8 098.08 |
|
| Return on Account |
634.58% |
877.61% |
0.74% |
|
| Return on Initial Capital |
2830064.00% |
2824032.00% |
6032.00% |
|
| Max Strategy Drawdown |
-$5 651.18 |
-$4 307.98 |
-$8 930.72 |
|
| Max Strategy Drawdown (%) |
-629.18% |
-1137.00% |
-621.17% |
|
| Max Close To Close Drawdown |
-$4 459.77 |
-$3 217.85 |
-$8 098.08 |
|
| Max Close To Close Drawdown
(%) |
-1566.60% |
-3891.00% |
-1164.22% |
|
| Return on Max Strategy
Drawdown |
5.007916931 |
6.555350768 |
0.006754215 |
|
| Profit Factor |
1.19975158 |
1.465986506 |
1.000743994 |
|
| Adjusted Profit Factor |
1.133564709 |
1.352078485 |
-0.923601859 |
|
| Select Profit Factor |
1.330457408 |
1.825046045 |
-0.992480795 |
|
| Max # Contracts Held |
1 |
1 |
1 |
|
| Slippage Paid |
$ 0.00 |
$ 0.00 |
$ 0.00 |
|
| Commission Paid |
$6 430.65 |
$3 214.68 |
$3 215.97 |
|
| Open Position P/L |
-$ 462.54 |
n/a |
-$ 462.54 |
|
| Annual Rate of Return |
98574.79% |
98364.68% |
210.10% |
|
| Monthly Rate of Return |
8214.57% |
8197.06% |
17.51% |
|
| Buy & Hold Return |
$ 3.09 |
$ 3.09 |
$ 3.09 |
|
| Avg Monthly Return |
$ 80.46 |
$ 80.46 |
$ 80.46 |
|
| Monthly Return StdDev |
$ 564.06 |
$ 564.06 |
$ 564.06 |
|
| Total # of Trades |
2492 |
1246 |
1246 |
|
| % Profitable |
54.01% |
59.07% |
48.96% |
|
|
| Performance Ratios |
|
|
| Upside Potential Ratio |
100.2797742 |
|
| Sharpe Ratio |
0.085535036 |
|
| Annualized Sharpe Ratio |
0.296302057 |
|
| Sortino Ratio |
2.716425902 |
|
| Fouse Ratio |
0.116570816 |
|
| Calmar Ratio |
0.005888021 |
|
| Sterling Ratio |
0.000961218 |
|
| RINA Index |
204.9089042 |
|
| Net Profit as % of Largest
loss |
1211.98% |
|
| Net Profit as % of Max Trade
Drawdown |
907.06% |
|
| Net Profit as % of Max
Strategy Drawdown |
500.79% |
|
| Select Net Profit as % of
Largest loss |
1118.83% |
|
| Select Net Profit as % of Max
Trade Drawdown |
837.35% |
|
| Select Net Profit as % of Max
Strategy Drawdown |
462.30% |
|
| Adj Net Profit as % of Largest
loss |
834.33% |
|
| Adj Net Profit as % of Max
Trade Drawdown |
624.43% |
|
| Adj Net Profit as % of Max
Strategy Drawdown |
344.75% |
|
|
| Time Analysis |
|
|
| Trading Period |
28 Yrs, 9 Mths, 17 Dys, 6 Hrs, 15
Mins |
|
| Time in the Market |
28 Yrs, 9 Mths, 17 Dys, 3 Hrs, 45
Mins |
|
| Percent in the Market |
100.00% |
|
| Longest flat period |
n/a |
|
| Max Run-up Date |
07/04/2025 |
|
| Max Drawdown Date |
13/03/2025 |
|
| Max Strategy Drawdown Date |
14/10/2025 09:00 |
|
| Max Close To Close Drawdown
Date |
09/10/2025 13:00 |
|
|
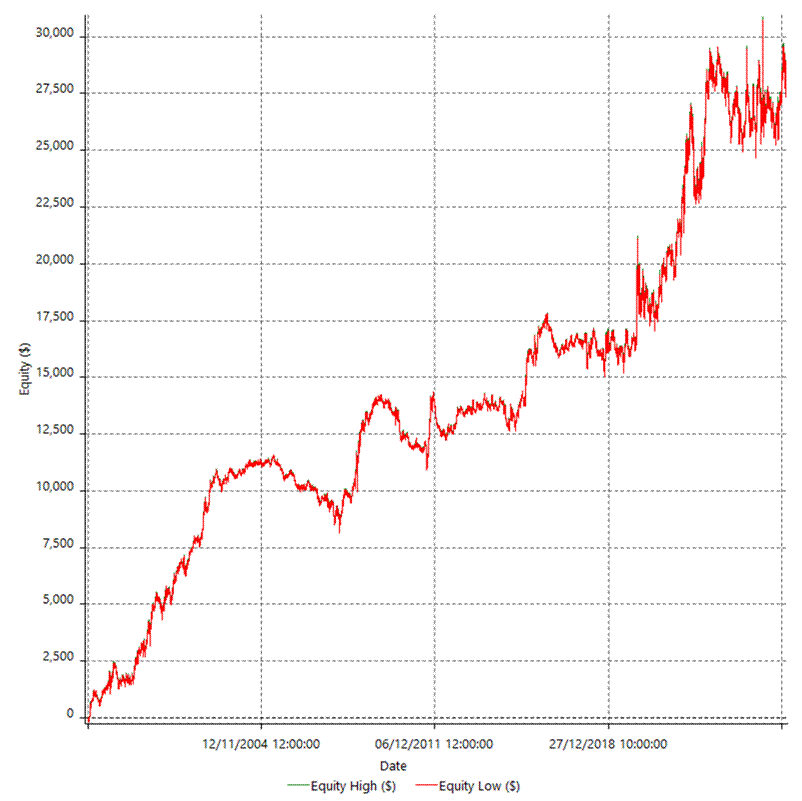
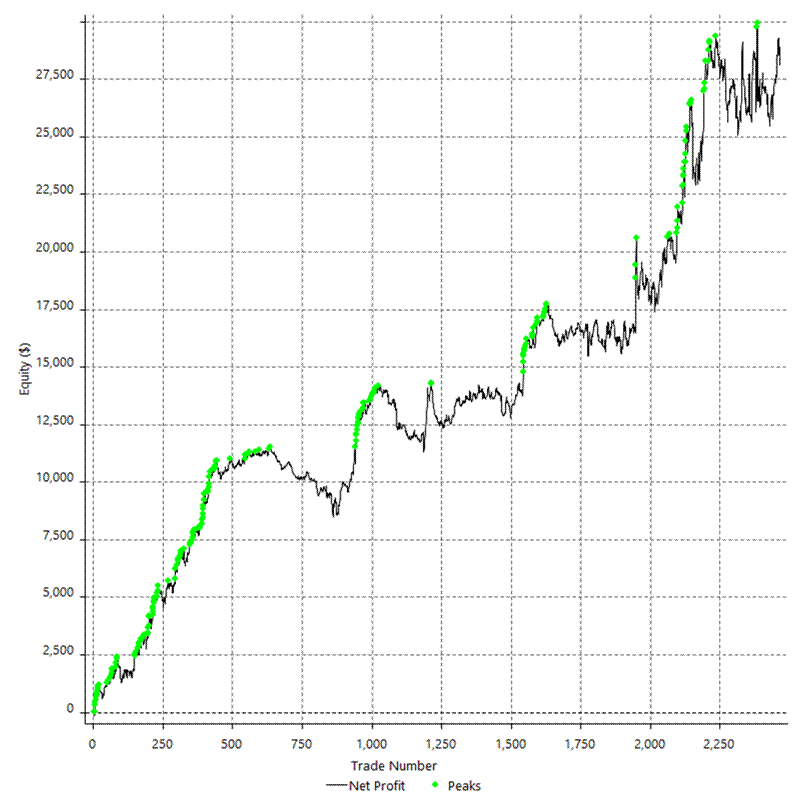
| Equity Curve Detailed |
|
|
|
|
|
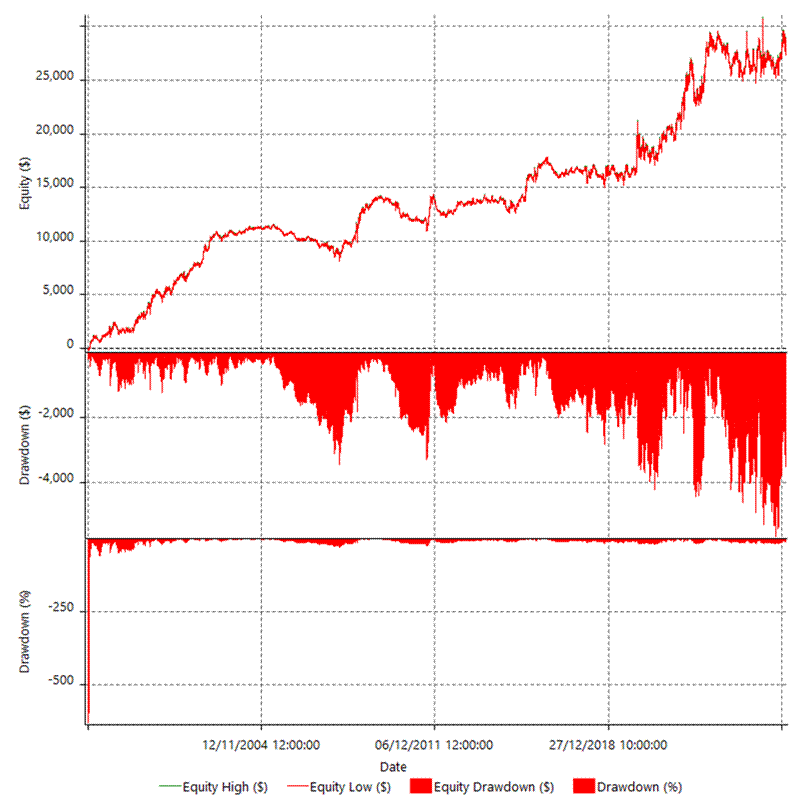
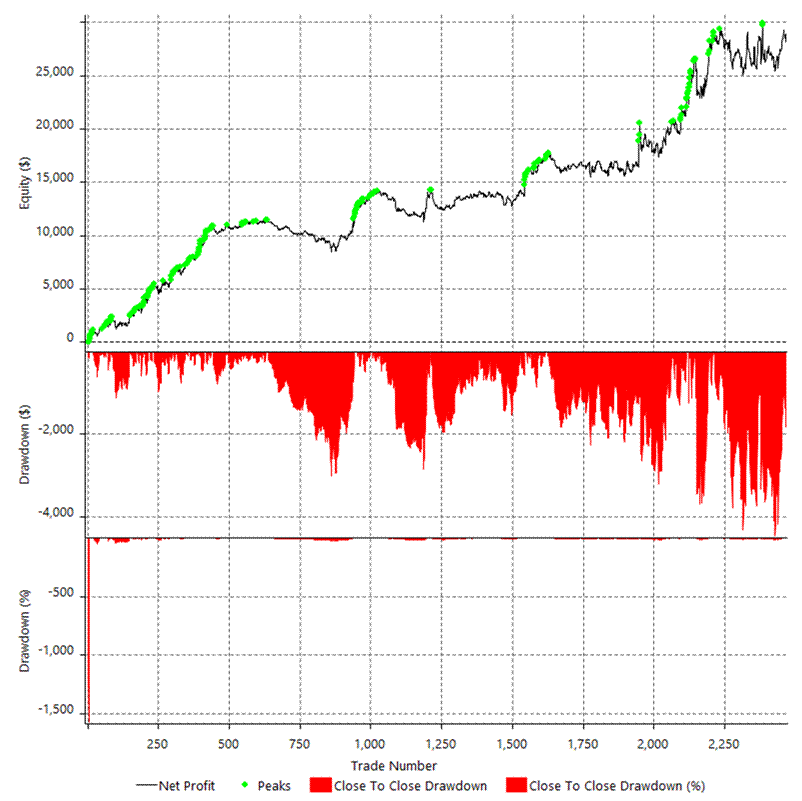
| Equity
Curve Detailed with DrawDown |
|
|
|
|
| Equity Curve Detailed Long |
|
|
|
|
| Equity Curve Detailed Short |
|
|

|
|
|
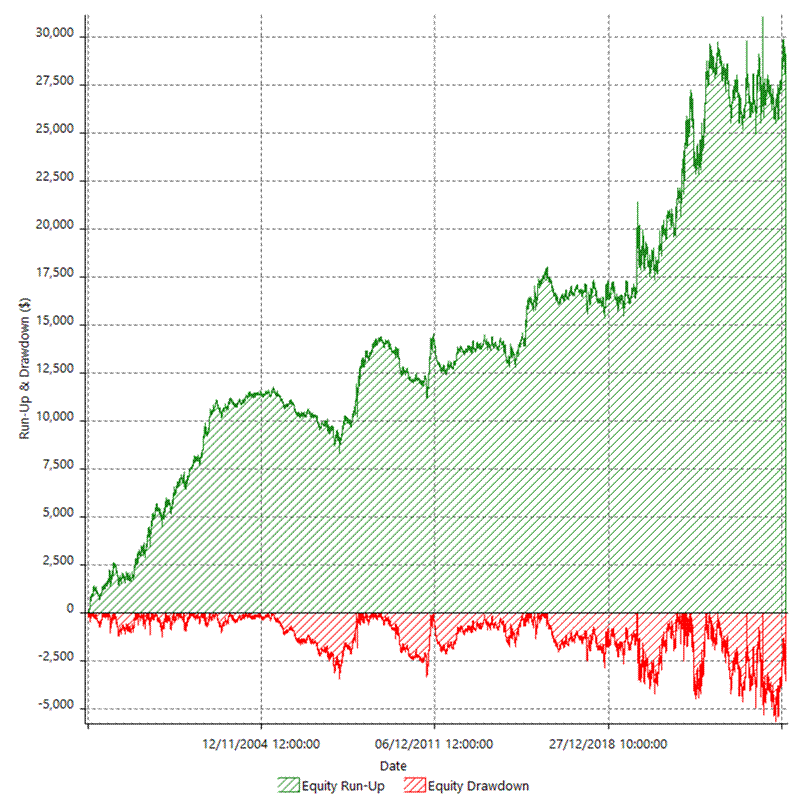
| Equity Run-up & Drawdown |
|
|
|
|
|
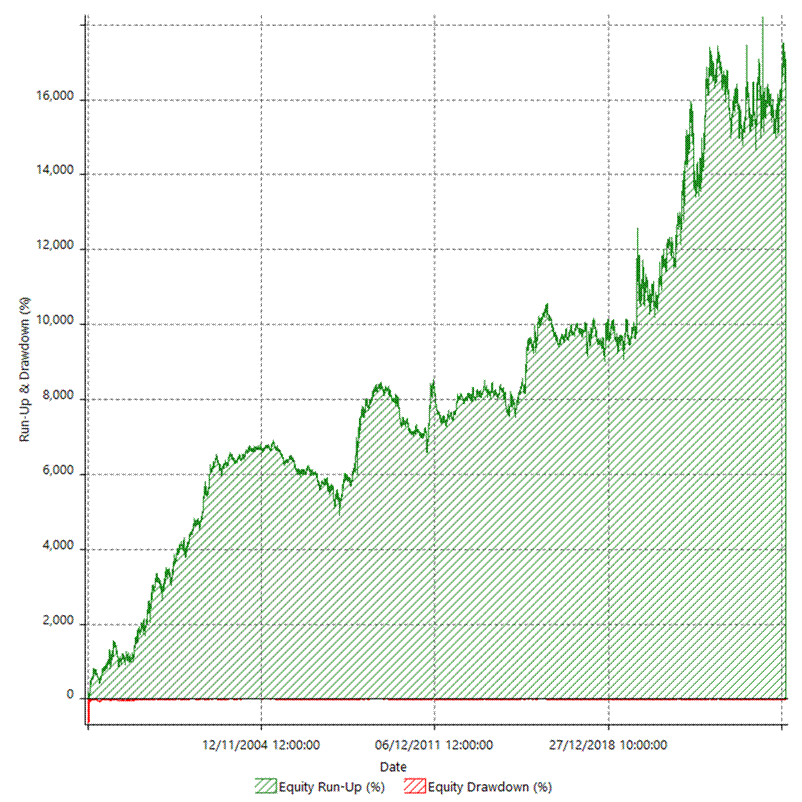
| Equity Run-up & Drawdown
(%) |
|
|
|
|
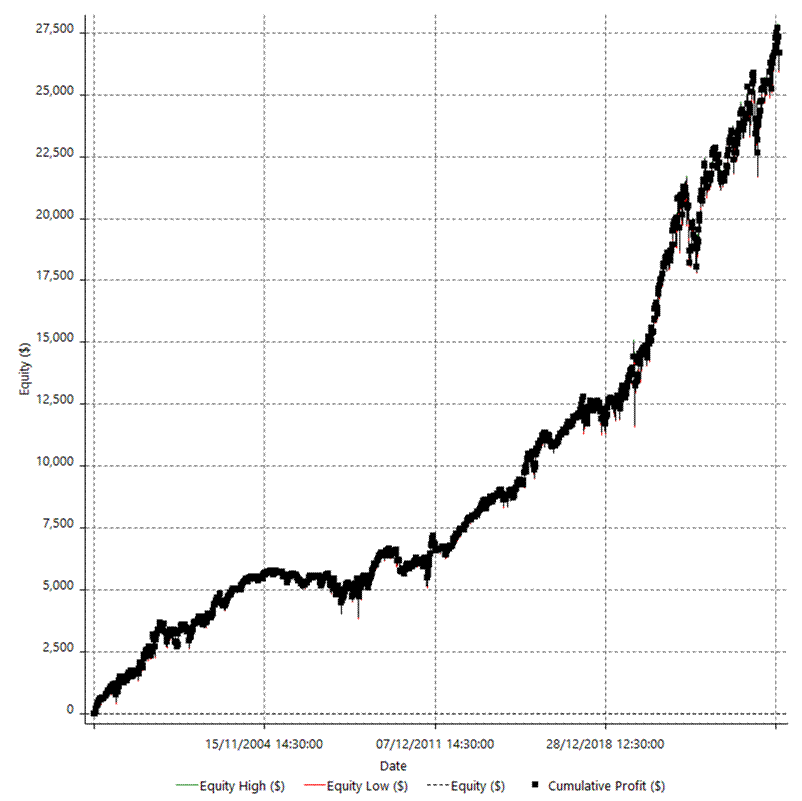
| Equity Curve Close To Close |
|
|
|
|
| Equity
Curve Close To Close With Drawdown |
|
|
|
|
|
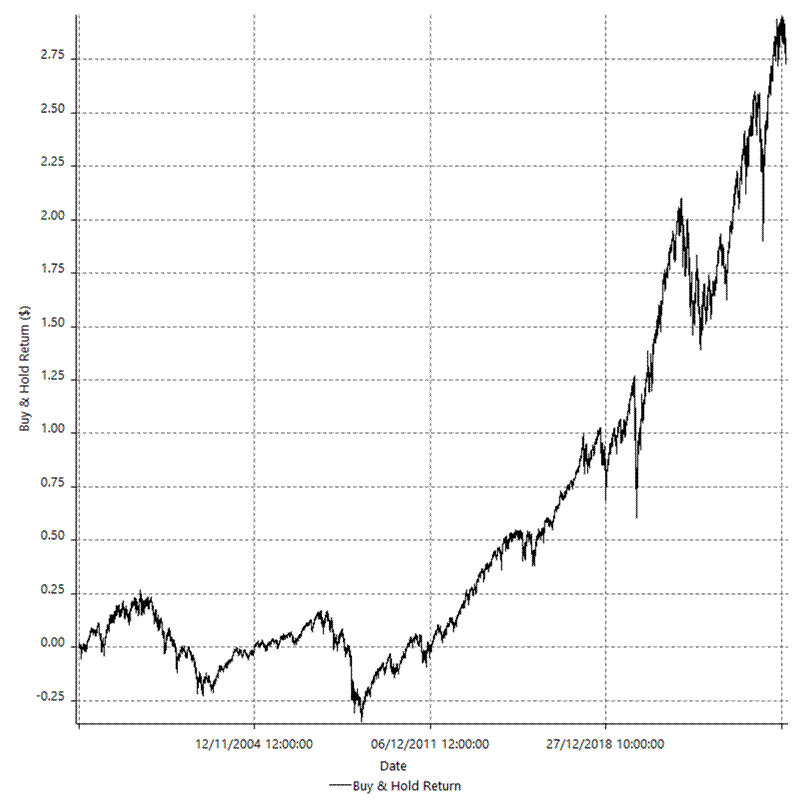
| Buy & Hold Return |
|
|
|
|
|
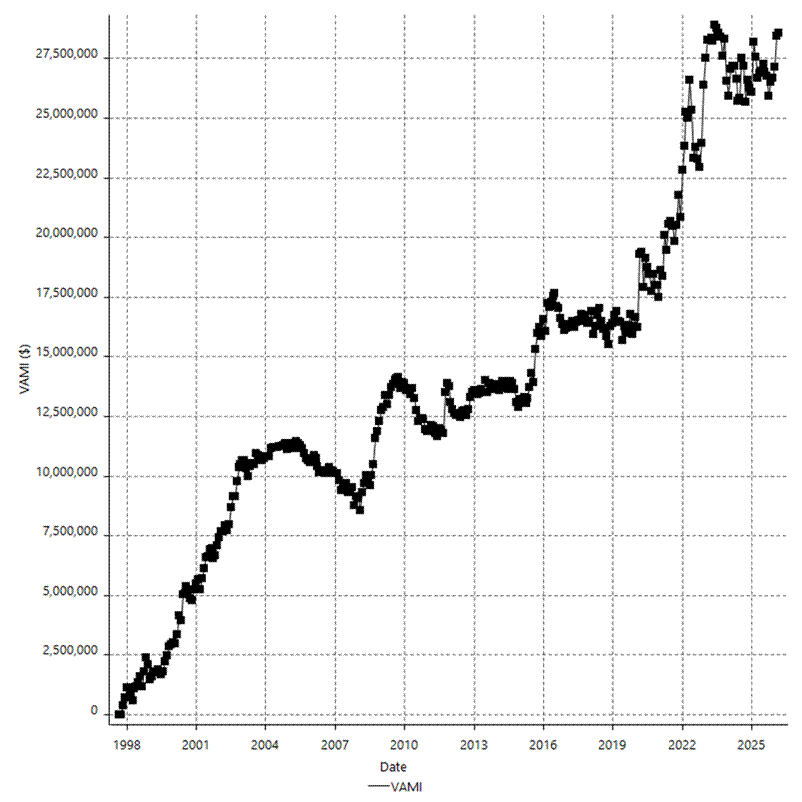
| Value Added Monthly Index |
|
|
|
|
|
|
|
|
|
|